Assignment 2

Your name:
Your email address:

Exercise 1:

Aligning F-ATPase alpha and beta subunits

Start SPdbV. (Refer to last week's class for setup instructions, if neccessary.)

Open 1bmf.pdb (right click-, then save target as)

Color Chain

Change color chainD to grey/blue (left click in control panel on "D" in first column to select chain D, left click on "COL" heading, select color) (The reason for this is that we want to color the ATP, ADP, and ATP analogs in red, which would not look nice if the Dchain is also colored in red.)

Scroll down the control panel and select all ADP/ATP analogs (press ctrl key and click to add to the selection). Hint: the ADP and ATP analogs (ANP) are found at the end of each of the chain listings. The ANP are analogs of ATP that cannot be hydrolyzed by the ATPase.

left click on COL in heading and select red color, and display the molecules as space filling by clicking on the cloud icon (::v) in the header (if multiple selection is too difficult using the mouse, you can color each of the ANPs ADP red individually)

Read the pdb file to get info on which chain is which (page icon in toolbar - take note of which chain is which subunit)

select chain F (including nuc) and save selected residues as betaTP (file, save selected residue of current layer...).

[Also, to follow the ATPases catalytic subunit through the catalytic cycle (see below), do the same for betaE (empty binding pocket) and betaDP (ADP in binding pocket)]

select chain A (including nuc) and save selected residues as alphaE.

After playing with the F1-ATPase, close this file and open betaTP and alphaE.

In WIND menu - display "Layers info"

select and display only the nucleotides (ANP600)

There are different ways to align 3-D structures. One way is to select 3 corresponding points in each of the two structures. To do so you can use the substrate molecule.

Using the mov check off in the Layer Info, reorient the two ANPs so that they are in a similar orientation (but not overlapping).

Click on the align button with the 3 green and 3 red dots (11th button from the left on the toolbar). Notice the tiny red instructions that appear in the header next to the pdb-page icon on the toolbar. Follow these instruction using three corresponding atoms in each of the two nucleotide molecules. You have to click exactly on the same atom in both structures, so if it doesn't accept your click, try neighboring atoms. Also try to locate atoms that occur in both structures in a location that is easy to pick out in both.

Hold down the SHIFT key, go to the display menu, show backbone as carbon atom trace (Shift makes the commands act on both layers). In the control window shift click into the display sidechain column to turn off the display of sidechains. SHIFT -> color secondary structure to indicate the secondary structure elements. Zoom out to make all of the subunits visible.

Pressing control and the tab key simultaneously switches the display between the two layers. (Alternatively, you can use the mov checks in the Layer info, move the two chains next to each other - switch the cursor to side way motion first!) .

What do you think about the result?

Your answer --->


Another way to align structures is to use the magic fit in the Fit menu. Do this and run improve fit also in the fit menu (notice the red info in the header)

Click on alpha in Layer info window to make the alpha subunit the active layer

Color CPK

Make the beta subunit the active layer

COLOR rms (The color reflects the root-mean-square distances between corresponding backbone atoms. The further the atoms in the beta subunit are away from the alpha subunit, the longer wavelengths (more red) it is the colored.

In the WIND menu chose alignment to display the alignment window - gives you the aligned sequences.

Which part of the molecule looks different between the Alpha vs. the Beta subunit?

Your answer --->

In the edit menu, choose Find Sequence. Type in the Walker Motif (G??G?GKT). Increase the number of mismatches allowed to 1.

Is the Walker motif (G??G?GKT) well aligned in the structure alignments and in the structures?

Your answer --->


Close all layers and open the three beta chains that you saved earlier (betaE, betaDP, and betaTP). Do an iterative fit followed by improve fit of betaE (ref layer) with betaDP (for imrove fit you need to have betaDP selected - the easiest is to use control tab). betaDP (ref layer) with betaTP. Display only the alpha carbons, color according to secondary structure (press shift which selecting a commands from the menus to have it act on all layers). It looks nice, if you select a space filling display for the substrate.

Press control tab on the keyboard to quickly cycle through the aligned layers, which represent the changes the subunit undergoes in the catalytic cycle.

Where in the catalytic cycle does the largest change in the structure occur? (Note: perhaps not surprisingly, this also correlates with the largest change in free energy, the surprise may be where this change occurs.)

Your answer --->

Exercise 2: We will continue exercise 2 next week.

Exploring intein structures in SPDBV

Background information:

Inteins are molecular parasites that have their own life cycle. Once they are in gene in one member of the population, they spread by super Mendelian inheritance. If as a consequence of sex of gene transfer, an infected and a non infected allele come together in one cell, the homing endonuclease activity of the intein makes a doublestrand cut in the DNA of the non infected allele. During the repair of the break the intein is copied into the allele. The other activity of the intein is a self splicing activity: The DNA encoding the intein is translated and transcribed together with the host gene. At the protein level, the intein removes itself from the host protein (aka as extein).

Once an intein is fixed in a population, there is nothing left to do for the homing endonuclease. The endonuclease activity decays and may ultimately be deleted, leading to mini-inteins that only contain the self-splicing domain. However, inteins with functioning homing endonucleases are known to persist in lineages over very long periods of time - see here and here.

Most inteins are composed of two domains: one is responsible for protein splicing, and the other has endonuclease activity. A few inteins have lost the endonuclease domain completely and retain only the self-splicing domain and activity. The latter inteins are called mini-inteins .

The structures of several inteins are crystallized.
  1. Open 1VDE in SPDBV. This structure has two chains. Save chain A to a separate file.

  2. Reopen chain A in SPDBV. Open Mycobacterium mini intein 1AM2. Align two structures using Magic Fit (in the fit menu). How good is the alignment? This requires you to make a judgment call.
    Your answer --->

    Depict the structures as ribbons and color them according to the secondary structure. Rotate two structures until you can see the similarities between mini intein and one of the domains of large intein. Move them on top of each other. Do "Fit -> Improved Fit...". Is this any better/worse?
    Your answer --->

    Can you find which part of Saccharomyces cerevisiae intein corresponds to the endonuclease domain by comparison of the two structures? [Manually inspect the two structures to find the similarities]. Color the putative self-splicing and endonuclease domains of 1VDE in two different colors. Select N and C terminals (First a.a. and the last a.a.) in both structures. How close are they (in angstroms)? [Click on the button with "1.5A" label--the fifth button from the left in the tool-bar, and select first and second a.a. to obtain the distance].
    Your answer --->
    Save your project.

  3. Open Saccharomyces cerevisiae intein that is bound to its recognition DNA sequence. Display intein (chain A) as ribbons with secondary structure color scheme (select color target with little black triangle in Control Panel). Color the DNA molecule as CPK, and compute hydrogen bonds (Tools - > compute H-bonds). Does the finding of DNA interaction domain agree with your previous assignment of the self-splicing domain? (see the saved structure from the previous exercise and decide which domain should be interacting with the DNA)
    Your answer --->

  4. Try to find a way to display the interactions between the aminoacid side chains and the DNA helix. One way to do it is to select two DNA chains and select Neighbors of selected amino acids. Choose "select groups that are within" option. Click on the "Cloud" (v) icon in the header of the control panel to display the aminoacids as balls. Also click in the header for showing sidechain. Manually turn off the cloud checkmarks for the DNA. One way to look at individual interactions is to turn the molecule so that one looks down the DNA helix, and select the "Display -> Slab" option. If you press shift while mouse cursor up and down the visible slice moves through the molecule along the axes perpendicular to the screen. If you press the shift key and move the mouse left and right you increase or decrease the size of the slab.

  5. The Lys 340 and Glu 366 are residues that are important for interaction with DNA. Select those residues (in Control panel choose label column to depict the label). Do they interact with major or minor groove of DNA? Which base pairs interact with these amino acids? (Hint- the major groove is the wider groove, while the minor groove is the thinner grove).
    Your answer --->


Finished? Leaving the lab? Head spinning? Remember to...

Choose one of the following options, then click the button.

Send email to your instructor (and yourself) upon submit
Send email to yourself only upon submit (as a backup)
Show summary upon submit but do not send email to anyone.


Optional exercises #1 :

Comparing divergent proteins with similar structures

load 2DLN.pdb load 1GSA.pdb
Are these structures similar? homologous?

Does Magic fit work?

For both structures Display the CA backbone only and color according to secondary structure. Use the layer info panel and orient the two structures so that they look similar.

Select the ADP molecules only

Use the 3 point alignment approach to align the ADP molecules

make the whole molecules visible again

move one structure over to the right (no turning)

select the ADP molecules

In the control panel header click on the cloud icon to display both ADPs in space filling mode.

In display click on render Q3D.

(To get more spectacular displays, you can save the pictures as POV files and use the program POV ray to make even nicer images)

If you have time, do the same for 1GSA, 2DLN and CPSBfrag and CPSFfrag . The latter two files are clippings of the front and back ATP binding sites of the carbamoyl phosphate synthetase (1BXR).

WHAT DOES THIS MEAN? Recall the use of 2DLN in PSI blast. Are all of these structures homologs? What does that tell you about evolution of proteins? An illustration is here .


Optional exercises #2 :

If you have more time to spare and you are up for a challenge, take a look at the nucleosome. Right click here and save as pdb file. Open it from within spdbv. You might want to do some of the future exercises with the nucleosome in addition to the ATPases - thus save the pdb file, where you can find it again.

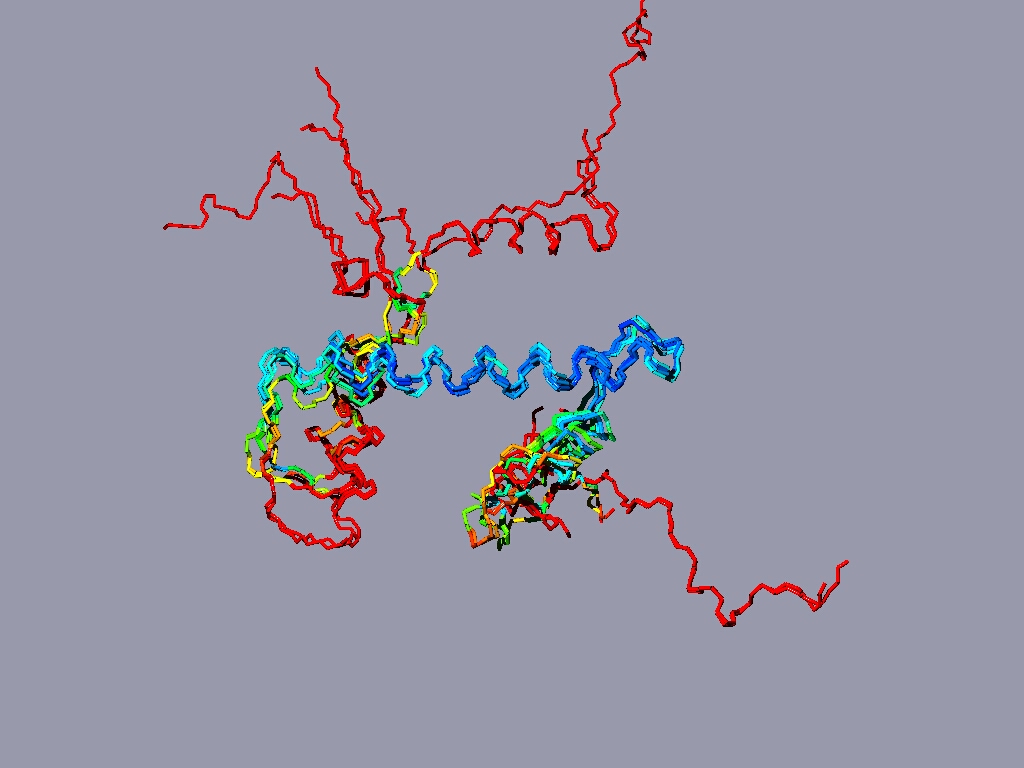
Align all the histones form the nucleosome to one reference histone and color in rmv:

The result might look something like this:

The picture shows a structure alignment of the 8 histones (2 each) that are part of the nucleosome. All the histones were colored regarding the match to H2A, except H2A, which was colored according to its match to H3. Coloring option RMS - shorter wavelengths - better match

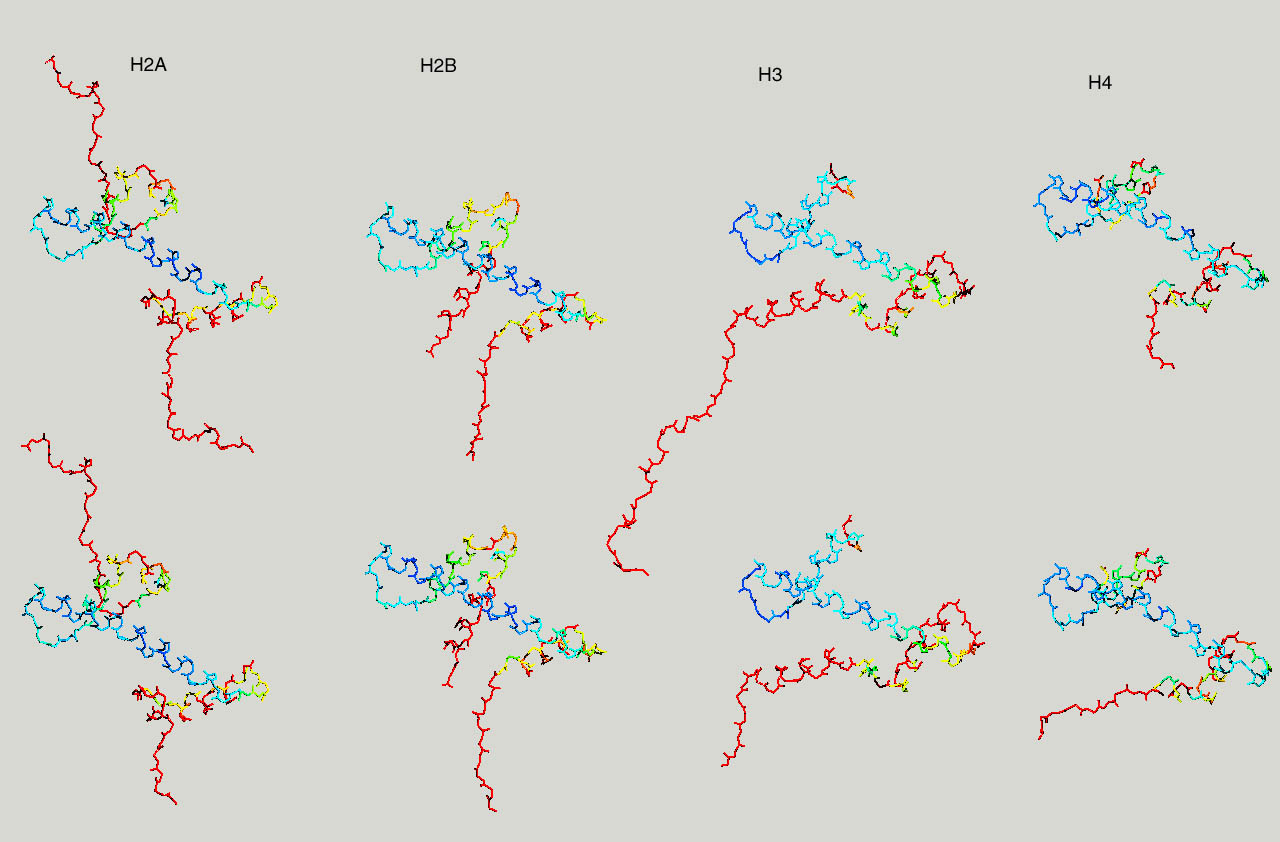
Below same as last figure, but histones are depicted side by side :

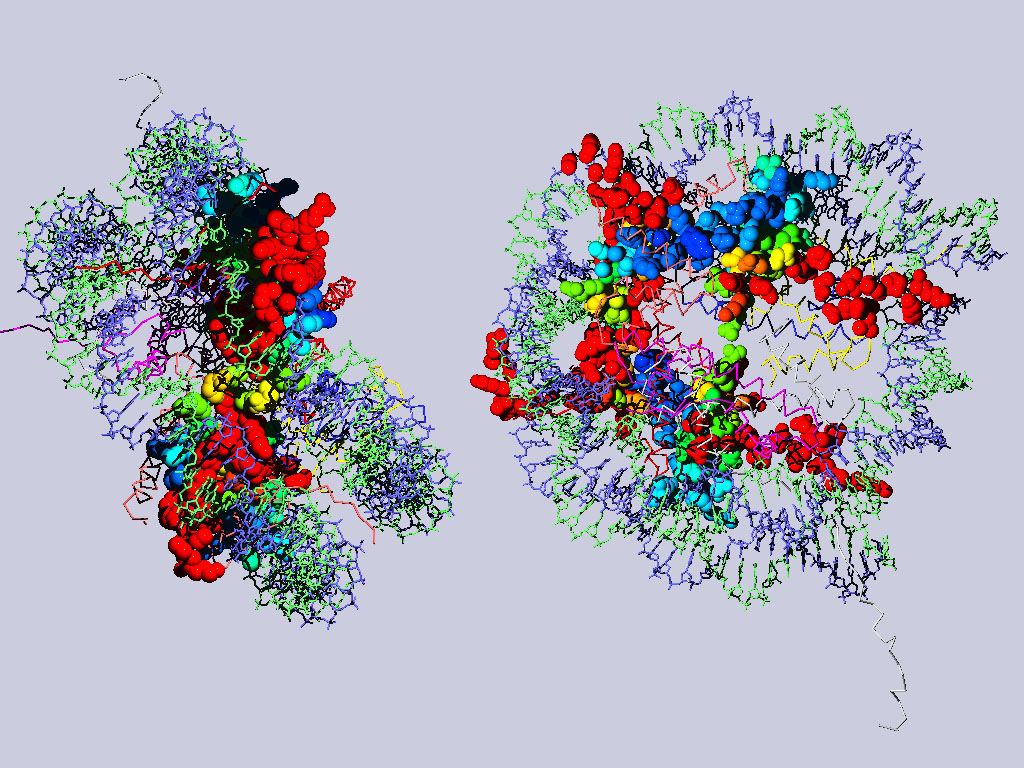
Below are two views of the complete nucleosome. Histones H2A are depicted as space filling balls and RMS colored regarding their match to H3. The rest of the molecule is colored according to chain.