The Clay of Evolution - How to study genes and genomes.
How
can genes get duplicated:
Whole genome duplication, partial genome duplication, single genes get
duplicated (tandem repeats)
Whole genome duplication: frequent event in plants, also speculated to have occurred at least twice in the early evolution of vertebrates. 15% of the yeast genome is present in duplicated form, the currently accepted idea is that there was an ancient duplication followed by rearrangement and gene loss. The idea of genome duplications in early vertebrate evolution has become very popular, but phylogeny of regulatory proteins does not support this idea (see here and here for pro and here for contra).
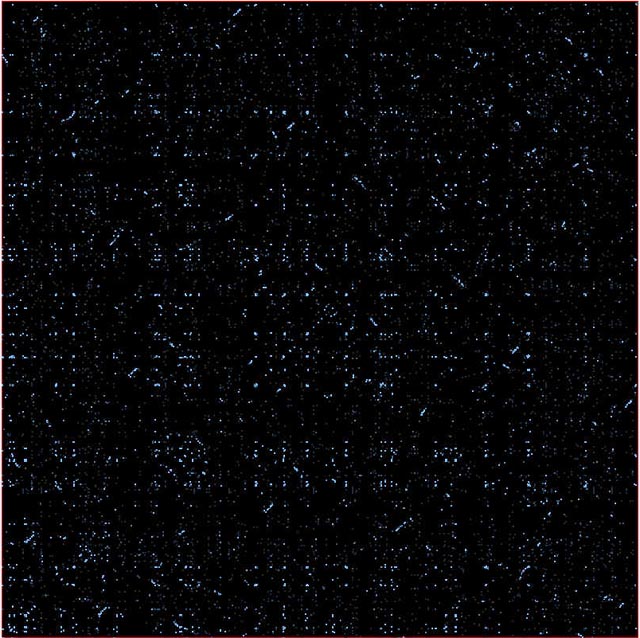
The picture below is a comparison of the Yeast proteome with itself (the diagonal is removed). It clearly shows many small regions of duplications.
Parts of chromosomes get duplicated: traces of this seen in Arabidopsis and Caenorhabditis
Single genes get duplicated -> gene families originally tandemly replicated (see the Caenorhabditis paper above)
Some TOOLS at NCBI
The NCBI provides several different interfaces to browse through and analyze genomes. For example, in the Borrelia genome, if you click on the complete genome, you get a graphical representation, further clicks move you down throw several levels to the nucleotide and encoded amino acid sequence. If you click on an ORF, you retrieve the sequence followed by an output of a blast search of this sequence against the nr database. The graphic representation shows you which part of the ORF generated the match, if you click on the number that represents the score, you open a new window with the alignment (again with nice graphics included). If you click on the number an window with the matching sequence in gb-format opens up. If the ORF is part of a cluster of putatively orthologous genes, you can get information on the cluster by clicking on the COGnumber.
From the Borrelia genome page, you can go to tables listing all ORF, or to taxtable, which provides an interesting nearest neighbor coloring of the genome. It is noteworthy that many of the pink dots are endonucleases. Also, there are many transporters among the odd colored genes.
In an attempt to capture some phylogenetic information in blast comparisons, Olendzenski et al. pioneered an approach to use multiple reference genomes to screen for putatively horizontally transferred genes (see Fig. 4). A similar approach, but using only two instead of three reference genomes is implemented in the TAX PLOT program at the NCBI's genome page (see below, if demo doesn't work).
You pick one genome to analyze, and two reference genomes. The program returns a plot of every ORF in the selected genome represented in a coordinate system, where the two coordinates are the highest alignment score with the two reference genomes:
Selected genome was from Borrelia burgdorferi. The list of selected genes is below:
| Definition | Blast2Seq | GenBank | Blink | |
| V-type ATPase, subunit B (atpB) [Borrelia burgdorferi] | 15594439 | => | ||
| aa | V-TYPE ATP SYNTHASE BETA CHAIN (V-TYPE A | 722 | 12585403 | => |
| aa | ATP synthase F1 alpha subunit [Aquifex a | 261 | 15606090 | => |
|
|
||||
| V-type ATPase, subunit A (atpA) [Borrelia burgdorferi] | 15594440 | => | ||
| aa | H+-transporting ATP synthase, subunit A | 1051 | 11498766 | => |
| aa | ATP synthase F1 beta subunit [Aquifex ae | 221 | 15607015 | => |
|
|
||||
| prolyl-tRNA synthetase (proS) [Borrelia burgdorferi] | 15594747 | => | ||
| aa | prolyl-tRNA synthetase (proS) [Archaeogl | 655 | 11499201 | => |
| aa | proline-tRNA synthetase [Aquifex aeolicu | 167 | 15605873 | => |
|
|
||||
| phenylalanyl-tRNA synthetase, beta subunit (pheT) [Borrelia burgdorferi] | 15594859 | => | ||
| aa | phenylalanyl-tRNA synthetase, subunit be | 709 | 11499019 | => |
| aa | phenylalanyl-tRNA synthetase beta subuni | 153 | 15606806 | => |
|
|
||||
| chemotaxis histidine kinase (cheA-1) [Borrelia burgdorferi] | 15594912 | => | ||
| aa | chemotaxis histidine kinase (cheA) [Arch | 798 | 11498645 | => |
| aa | histidine kinase sensor protein [Aquifex | 86 | 15605839 | => |
|
|
||||
| methionyl-tRNA synthetase (metG) [Borrelia burgdorferi] | 15594932 | => | ||
| aa | methionyl-tRNA synthetase (metS) [Archae | 873 | 11499048 | => |
| aa | methionyl-tRNA synthetase alpha subunit | 436 | 15606482 | => |
|
|
||||
| spermidine/putrescine ABC transporter, ATP-binding protein (potA) [Borrelia burgdorferi] | 15594987 | => | ||
| aa | spermidine/putrescine ABC transporter, A | 678 | 11499200 | => |
| aa | ABC transporter [Aquifex aeolicus] | 325 | 15607081 | => |
|
|
||||
| lysyl-tRNA synthetase [Borrelia burgdorferi] | 15595004 | => | ||
| aa | lysyl-tRNA synthetase (lysS) [Archaeoglo | 642 | 11498815 | => |
| aa | cysteinyl-tRNA synthetase [Aquifex aeoli | 92 | 15606347 | => |
|
|
||||
More on Comparing Genomes:
Genome dot plots allow to compare two genomes (or rather the ORFs encoded in these genomes). In contrast to a normal dot plot, one does not move a window through the sequence, rather one takes one ORF at a time and compares it to the other genome.
Robert L. Charlebois' genome and
bioinformatics site performed these and other analysis.
Sadly, this site is no longer free.
For example BLASTP-based dot plot of Pyrococcus abyssi vs Pyrococcus horikoshii depicted below clearly reveals inversions, and a duplication (two parallel diagonals), the latter can also be detected by comparing a genome to itself.
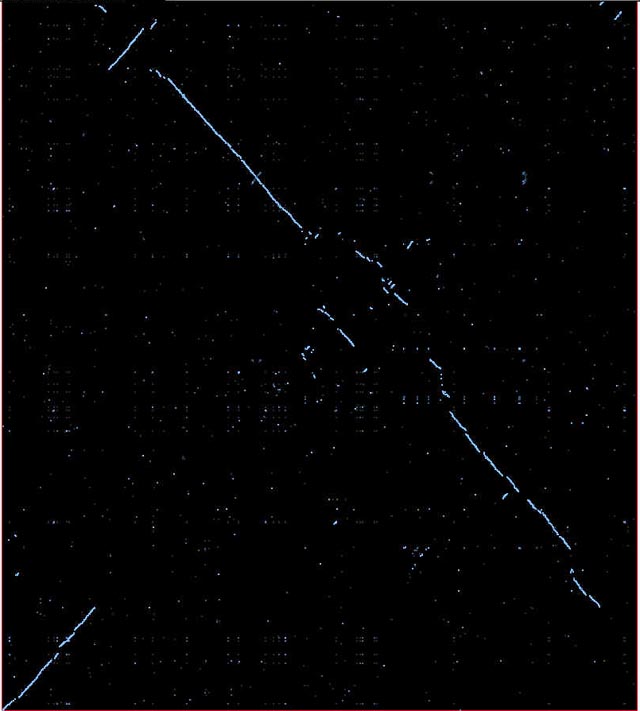
See this paper from Tillier and Collins on a discussion of this and similar patterns.
Automation of Repetitive Tasks
(to look at the tree go to phylodendron, or copy paste into treeview)