Introduction to SPdbV, manipulation and display of a single subunit proteins with bound substrate
There are several programs that allow the inspection and manipulation of 3-D structural protein data. In this course we use the Swiss
Protein Data Bank Viewer.
These are several excellent on-line tutorials available to learn the use SPDBV:
The basic tutorial at http://www.usm.maine.edu/~rhodes/SPVTut/index.html
And a course on structure, spdbv, and modeling
http://www.expasy.ch/swissmod/course/course-index.htm
The exercise in this section is taken with slight modifications from Gale Rhode's the basic tutorial, many of the exercises in the
following sections parallel exercises in the basic tutorial.
Exercise:
- Start SPDBV
- Go to PDB and retrieve 1HEW. Load 1HEW.pdb (menu File->Open PDB File...)
- Click on the three cursor control buttons on the toolbar and rotate/move/enlarge lysozyme picture
- Click on the Page Icon and go through the pdb file
- open the Control Panel (Window menu).
- open the Alignment (Window menu)
- select all by clicking on the left side of a.a. labels in the Control Panel, or go to menu Select->All
- display Ramachandran plot (Window menu)
- in the control window select different residues by clicking once one them. What happens to Ramachandran Plot?
- select all
- Explore different coloring (CPK, secondary structure, accessibilty) and display options (show CA trace only, show oxygen,
...) [options are under Color and Display menus respectively]
- Select (left mouse button at the bottom of the control panel) the NAG inhibitor NAG201-203.
- Color them Yellow (through Control Panel
- Invert selection (Select->Inverse Selection)
- Color as secondary structure
- Invert selection
- Tools -> Compute H-Bonds
- Right click side column in the Control Panel to turn off sidechain display
- select Neighbors of selected aa (under Select Menu)
- click right mouse button on side header in control panel (acts only on selected residues)
- Select Non polar a.a.[Select->Group properties->Non-polar aa]
- click on Header COL in display panel select blue color to color hydrophobic residues blue
- Are there "blue" residues interacting with the N-Acetyl glucosamines? How come?
- Play around, if in doubt use the ? button.
- Open the alignment window and display the complete lysozyme molecule. Observe the color change in the structure that
happens when you move the mouse over the sequence in the alignment window.
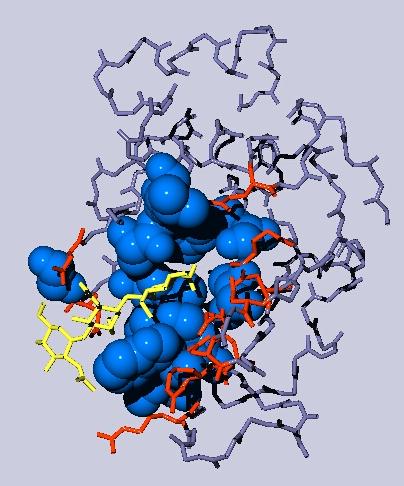
- The resulting display after some beautifications might look like this:
yellow: the NAG inhibitor;
blue: residues in the binding pocket that are non-polar, depicted as space filling balls;
red: other amino acids in the binding pocket;
gray: the rest of the Lysozyme molecule, but only the backbone.
Other things to try:
- 3D rendition (in the display menu),
- slab view (shift and mouse move the slab),
- If you right click on a residue in either the alignment window or the control window, the display centers on this residue.
- Control and mouse click adds residues to the list of selected residues (works in either window)
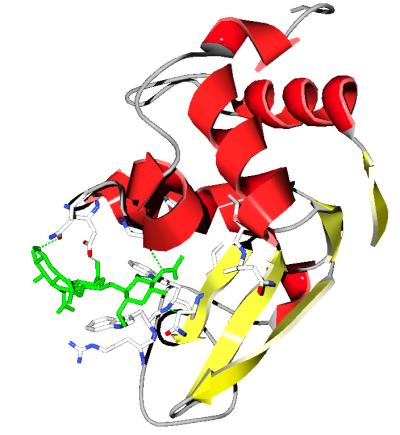
- Can you obtain a figure similar to the one below?
[Go to the control panel click on the little black triangle to the right of the col column and select color ribbon, then
secondary structure in the color menu. Display ribbon in the control panel, remove the other displays .....]