CLASS 18. Cladistics. Types of Homology. Mutations and Substitutions.
Ch.10 (textbook);
Section 7.1, 7.2, 8.1 (supp.textbook);
Fitch, 2000 (Moodle)
Terminology from Cladistics
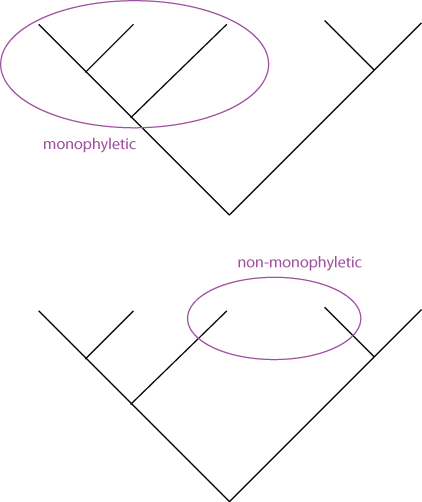
The term cladogram refers to a strictly bifurcating diagram, where each clade is defined by a common ancestor that only gives rise to members of this clade. I.e., a clade is monophyletic (derived from one ancestor) as opposed to polyphyletic (derived from many ancestors).
A clade is recognized and defined by shared derived characters (= synapomorphies [derived from the Greek words syn = with, in company with, together with; apo = away from; and morphe = shape.]). Shared primitive characters (= sympleisiomorphies) do not define a clade.
- Example of synapomorphy that defines Diptera clade: Halteres
To use these terms you need to have polarized characters; for most molecular characters you don't know which state is primitive and which is derived.
Related terms:
autapomorphy = a derived character that is only present in one group; an autapomorphic character does not tell us anything about the relationship of the group that has this character ot other groups.
homoplasy = a derived character that was derived twice independently (convergent evolution). Note that the characters in question might still be homologous (e.g. a position in a sequence alignment, front limbs turned into wings in birds and bats).
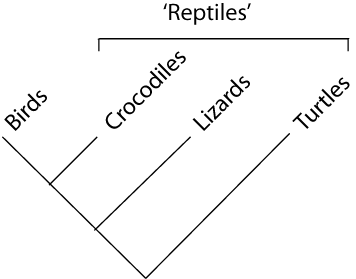
paraphyletic = a taxonomic group that is defined by a common ancestor, however, the common ancestor of this group also has decendants that do not belong to this taxonomic group. Many systematists despise paraphyletic groups (and consider them to be polyphyletic). Examples for paraphyletic groups are reptiles and protists. Many consider the archaea to be paraphyletic as well.
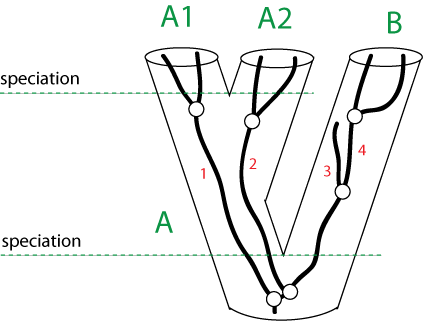
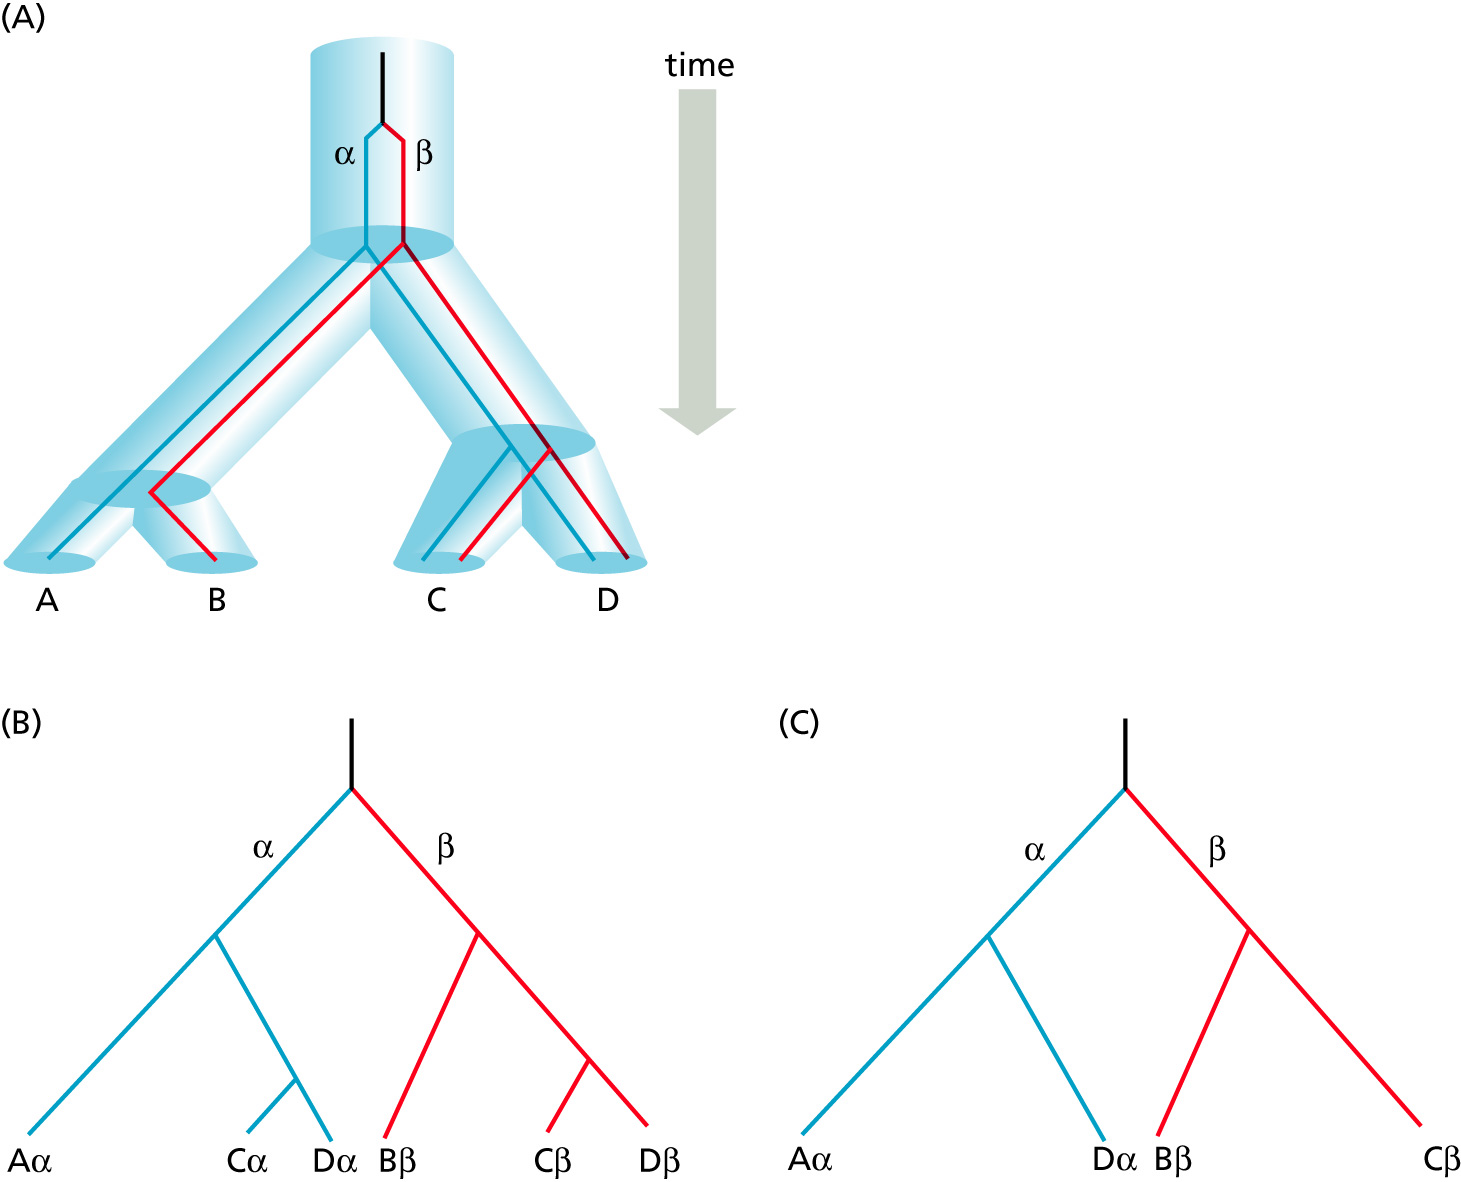
Gene Trees vs. Species Trees
Why could a gene tree be different from the species tree?
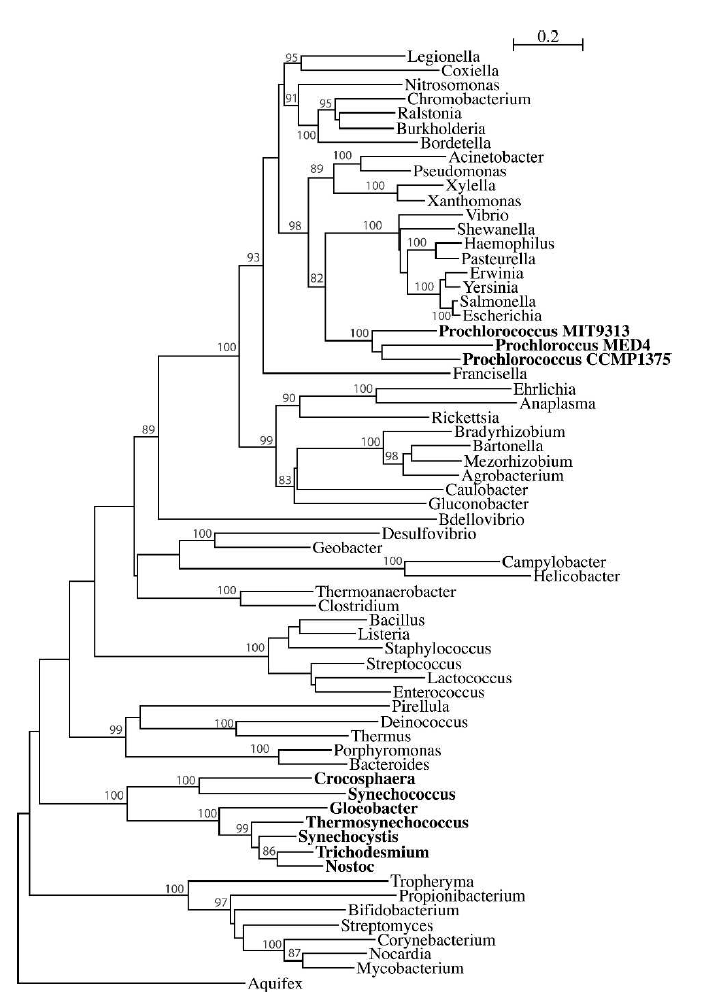
(Fig. 5 in Zhaxybayeva et al, 2006)
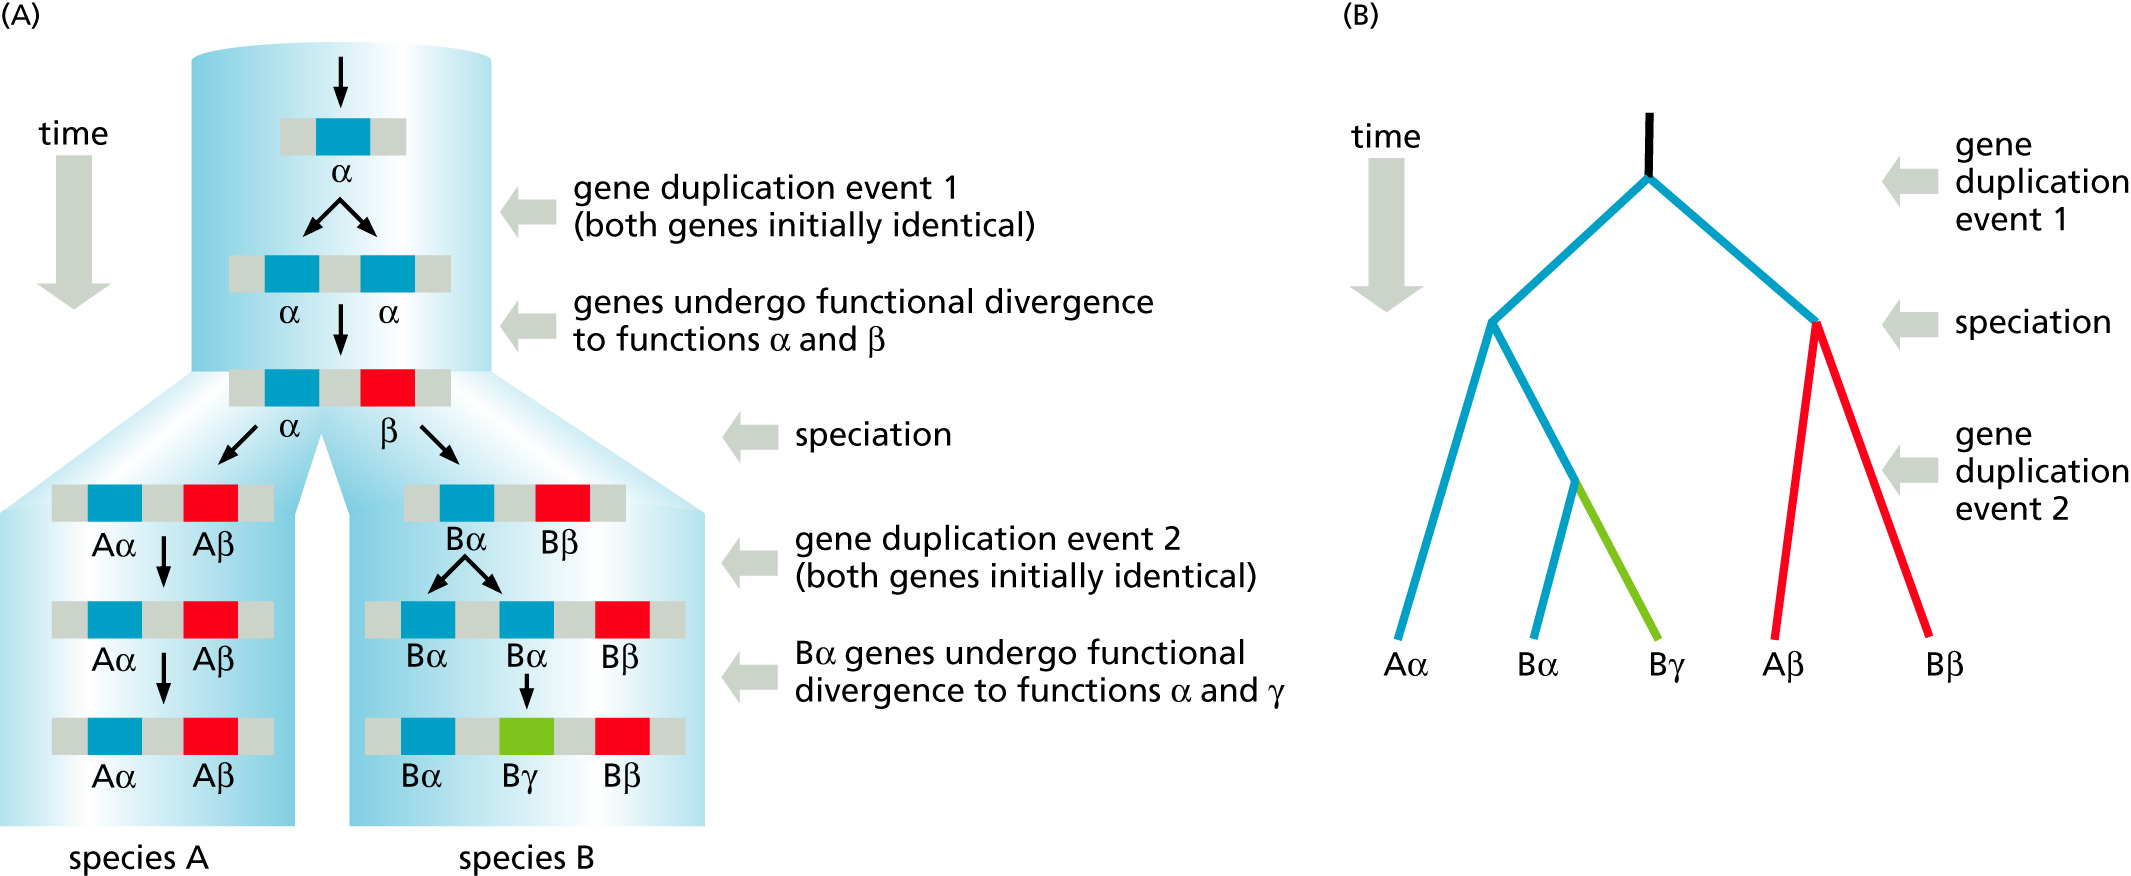
Types of Homology
Evolution of protein families: Homology (shared ancestry) versus Analogy (convergent evolution)
Orthology: bifurcation in molecular tree reflects speciation
Paralogy: bifurcation in molecular tree reflects gene duplication
Xenology: gene was obtained by organism through horizontal transfer
Synology: genes ended up in one organism through fusion of lineages.
Orthologs: bifurcation in molecular tree reflects speciation. These are the molecules people interested in the taxonomic classification of organisms want to study.
Paralogs: bifurcation in molecular tree reflects gene duplication. The study of paralogs and their distribution in genomes provides clues on the way genomes evolved.
Gene and genome duplication have emerged as the most important pathway to molecular innovation, including the evolution of developmental pathways.
Xenologs: gene was obtained by organism through horizontal transfer. The classic example for Xenologs are antibiotic resistance genes, but the history of many other molecules also fits into this category: inteins, selfsplicing introns, transposable elements, ion pumps, other transporters, etc. etc.
Synologs: genes ended up in one organism through fusion of lineages. The paradigm are genes that were transferred into the eukaryotic cell together with the endosymbionts that evolved into mitochondria and plastids.
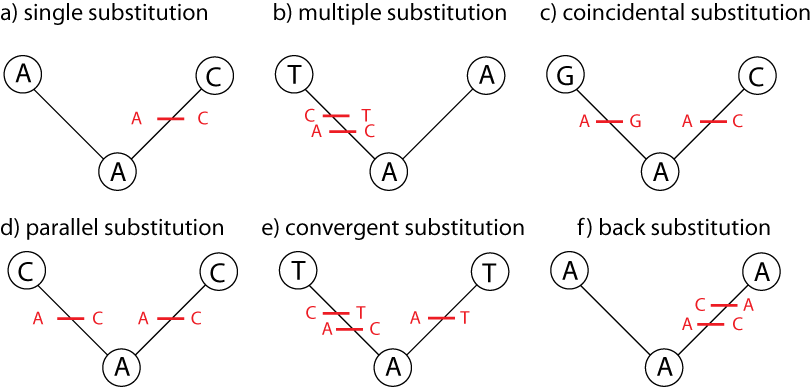
Mutations and Substitutions
Mutations are errors in DNA replication or DNA repair. A point mutation is mutation that affects a single nucleotide. Type of change caused by mutation:
- Replacement of one nucleotide by another (substitution)
- Recombination
- Deletion
- Insertion
- Inversion
Nucleotide substitutions can be further classified into:
- transitions (substitution between A and G [purines] or between C and T [pyrimidines])
- transversions (substitutions leading to change from purine to pyrimidine and vice versa)
If nucleotide substitutions occur in protein-coding genes they can be:
- synonymous, or silent (cause no amino acid change)
- non-synonymous (otherwise), which are further classified into missense and non-sense ones.
Deletions and insertions in protein-coding genes may result in frameshift mutations.
Measuring Genetic Change
Given two aligned sequences, one question we can ask is "How much evolutionary change has occurred between these sequences?"
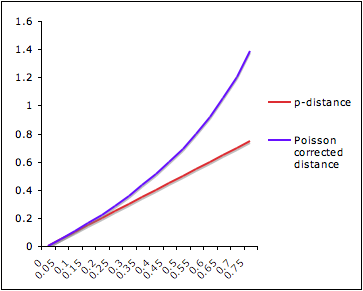
The simplest measure of evolutionary distance is so-called p-distance:
where D is number of sites where sequences differ and L is alignment length.
Just counting the number of sites at which the two sequences are different is too simplistic:
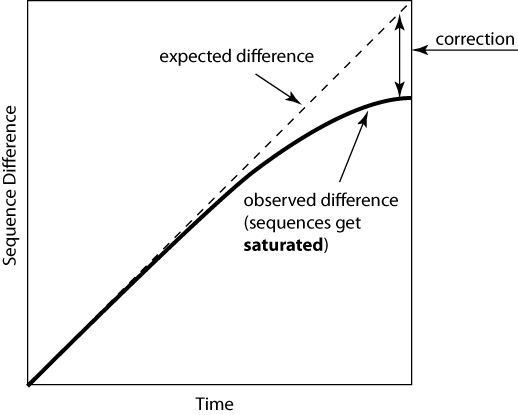
Poisson Distance Correction
Let's make an assumption that the probability of a substitution at a site follows a Poisson distribution and rate of substitution r is uniform per site per time unit. After time t, the average number of substitutions per site will be rt.
The probability of n substitutions occurring at a site over time period t is f(rt,n)=e-rt(rt)n/n!.
Let's look at two sequences that diverged from their common ancestor time t ago. The probability of n=0 substitutions occurring at a site is e-rt (see formula above) for each sequence and e-2rt for both of them. And e-2rt=(1-p), where p is a p-distance.
Under assumption that two sequences evolved independently from their ancestor, evolutionary distance between them is d=2rt. => 1-p=e-d => d=-ln(1-p).