CLASS 3. Homology. Pairwise Sequence Alignment.
Homology vs. Similarity vs. Identity
Ch.3 (textbook);
Sections 4.1-4.4; (supp. textbook);
pp. 129-135 (supp. textbook);
OR
Eddy, 2004 (Moodle);
Sections 5.1,5.2,5.4 (supp. textbook); [optional, detailed theory]
Fitch, 2000 (Moodle)
For DNA and protein sequences, homology is inferred by showing significant similarity between sequences. Sequence similarity is expressed either as percent of identical matches (sequence identity) or (for protein sequences) as percent of identical matches AND matches of amino acids with similar physicochemical properties (sequence similarity).
Because two sequence of potentially different lengths are involved in the comparison, either average length (Lavg) of two sequences used, or the length of the shorter sequence (Lshort) used. That is, sequence similarity
or
S=Ns(short)/Lshort*100
where Ns is number of similar residues and Ns(short) is number of similar residues in the shorter sequence.
Homology is a qualitative statement. As Walter Fitch wrote, "[H]omology, like pregnancy is indivisible. You either are homologous (pregnant) or you are not" (Fitch, Trends in Genetics, 2000, 16: p.228; See Moodle for the article). If quantitative assessment is needed, IDENTITY or SIMILARITY is used (for example, two DNA sequences are 75% identical).
Aligning Two Sequences
- Take two sequences
- Align them (or parts of them)
- Assess similarity between the sequences (by assigning a score)
- Decide if the alignment score is significant or if two randomly selected sequences can have the same score
- If significant, claim homology
The goal of alignment of two sequences (pairwise alignment) is to find the relative positioning of them that maximizes the number of matching residues (or more precisely, maximizes the alignment score). When sequences are aligned across their whole lengths, the alignment is global. Local alignment refers to alignments of subsequences (i.e. only pieces of sequences are aligned).
During the alignment procedure it is almost always necessary to introduce gaps. Gaps are either insertions or deletions in a sequence. Sometimes they are also called indels. Introduction of gaps is penalized (no widely accepted theory on gap penaties). The idea is to find the least costly solution in terms of mismatches and gaps.
Matches and mismatches in alignments are quantified through scoring matrices, also called Substitution Matrices. For nucleotide sequences, Unitary Matrix (or Identity Matrix) is used: a match scores +1, a mismatch scores 0 (Another scoring scheme that involves considering gaps is +1 for a match, -1 for mismatch and -2 for insertion of a gap). For protein sequences, either matrices taking into account physicochemical properties of amino acids or, more commonly, empirically derived scoring matrices are used. The latter types of matrices are based on substitution frequencies determined in alignments of homologous sequences.

The numbers in the matrix are log-odds scores (ratios), i.e. logarithm of a ratio of observed frequency of substitution to the substitution frequency expected by chance. More frequently observed amino acid substitutions have positive scores. A score of zero means that this type of substitution is as likely to be by chance alone.
Commonly used types of alignment algorithms:
- Visual: Dot Plots
- Dynamic Programming (e.g., Needleman-Wunsch and Smith-Waterman algorithms) - slow, but guaranteed to find optimal alignment
- Heuristic Search - fast (BLAST)
Dot Plots
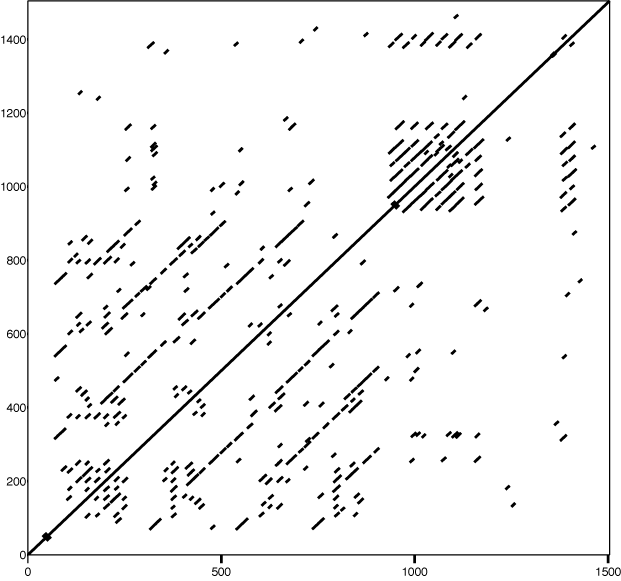
Generated with DotMatcher.
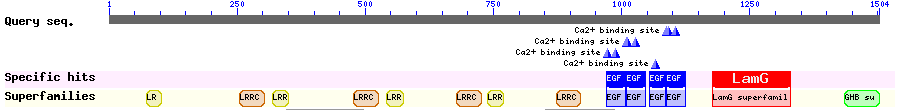
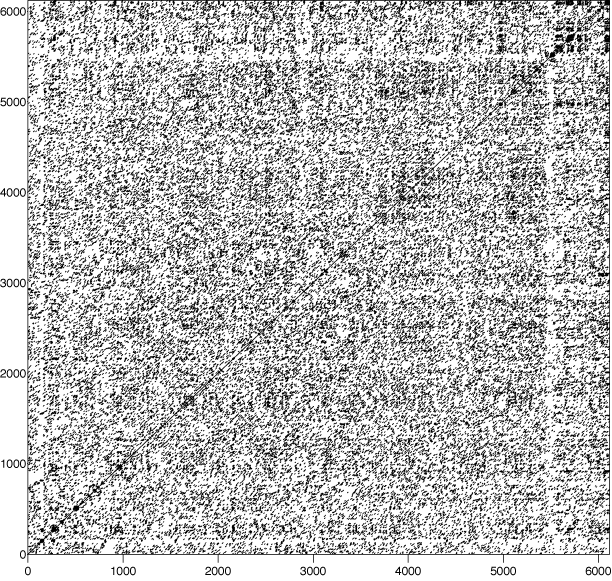
Generated with DotMatcher.
Variation of Needleman-Wunsch Alignment Algorithm (an example of Dynamic Programming Algorithm)
We are going to align two hypothetical protein sequences "THISLINE" and "ISALIGNED", using BLOSUM62 substitution matrix and a simple gap penalty g(ngap)=-E*ngap, where ngap is the number of gaps. We will try E=-8 and E=-4. [read pp. 129-135 (supp. textbook)]
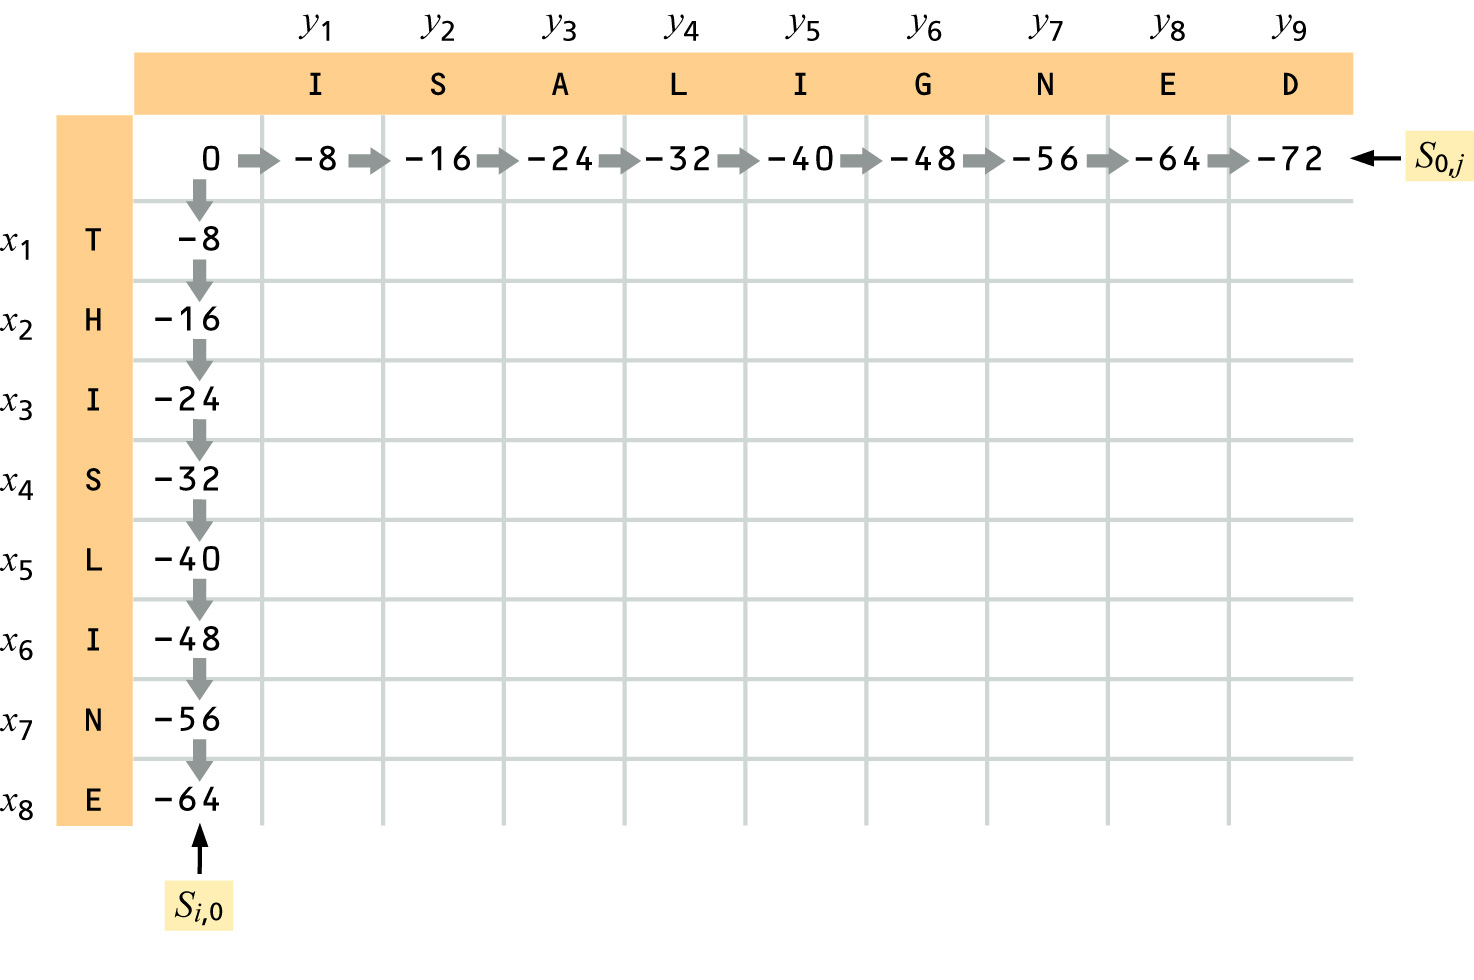
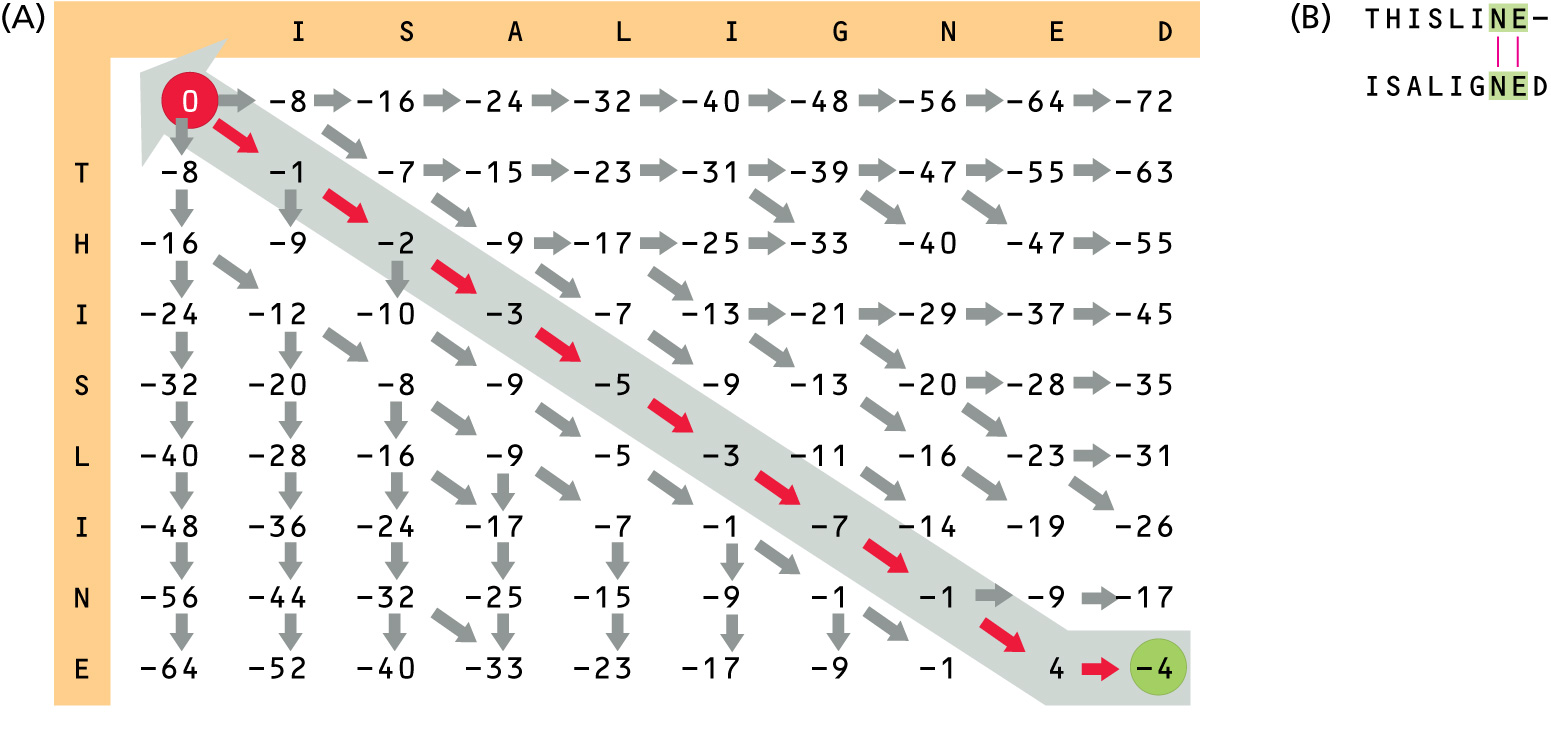
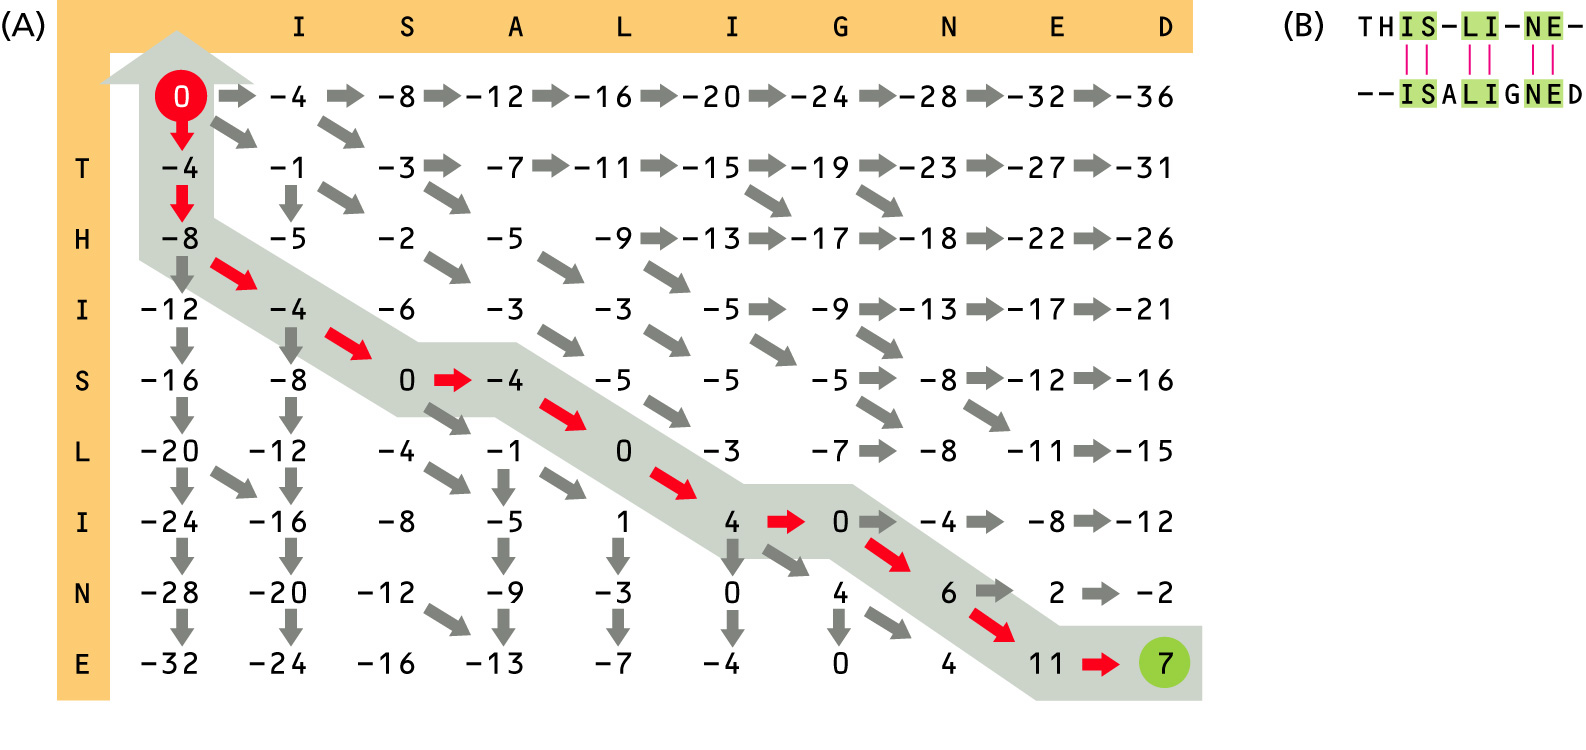
Usually a more sophisticated gap penalty formula is used, where penalties for initiating (opening) and extending gaps are different: g(ngap)=-I-E*(ngap-1).
Statistical Significance of Sequence Alignment
- align two sequences and calculate alignment score
- randomize (scramble) one (or both) of the sequences and calculate the alignment score for the randomized sequences.
- repeat step 2 at least 100 times
- describe distribution of randomized alignment scores (it turns out to be Gumbel Extreme Value Type I Distribution)
- do a statistical test to determine if the score obtained for the real sequences is significantly better than the score for the randomized sequences