CLASS 30. Maximum Likelihood and its applications.
IMPORTANT ANNOUNCEMENT: CLASS FOR MARCH 31 IS CANCELLED.
Maximum Likelihood
Ch. 10,11 (textbook);
Ch. 8 (supp. textbook);
Given a model for sequence evolution, find the tree that has the highest probability (likelihood) of reproducing the observed data under this model (the tree is then called maximum likelihood estimate of the phylogeny).
Likelihood describes how well the model predicts the data: L = Pr (sequence data|tree, model). However, likelihood does not say anything about the probability of the model itself: Elliot Sober's Gremlins.
Requirements:
- Model of sequence evolution
- A tree (selected by a user or through heuristic search)
- Observed data (sequence alignment)
(adopted from Page & Holmes, Molecular Evolution, Blackwell Science 1999).
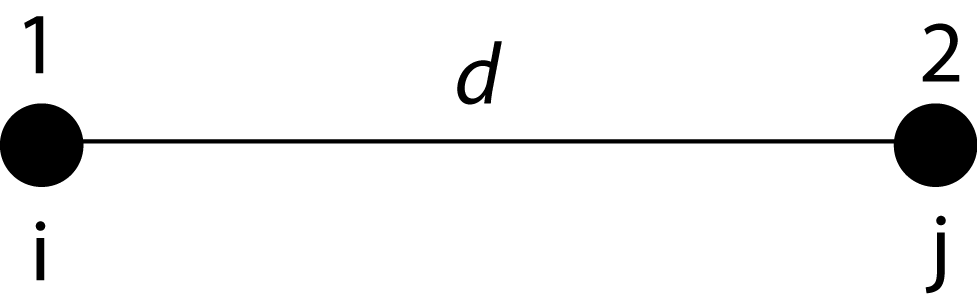
Lk = Pij(d): probability that two sequenced separated by distance d would have nucleotides/a.a. i and j at each node.
ln L = Σ ln Lk, k is summed over all sites.
In a real tree, there will be internal nodes (with unknown states) and branch lengths. To compute the likelihood in a given site, all possible combinations of ancestral states need to be considered and maximum likelihood estimates of branch lengths need to be obtained. This is a computationally expensive process for large data sets and finding the most efficient way to search tree space is an active area of research.
Tree reconstruction programs that use ML
Finding ML trees can be very time consuming. Quartet Puzzling is an approximate likelihood algorithm to search for a tree [method paper].
Three steps of quartet puzzling algorithm:
- Evaluate three tree topologies and optimize branch lengths for every possible four sequences in a dataset (quartet) using ML.
- Combine the quartet trees to an overall n-taxon tree (puzzling step). A starting quartet is chosen at random and taxa are added one at a time. This step is repeated multiple times.
- A majority-rule consensus tree of all quartets is reconstructed from the intermediate trees of the puzzling steps.
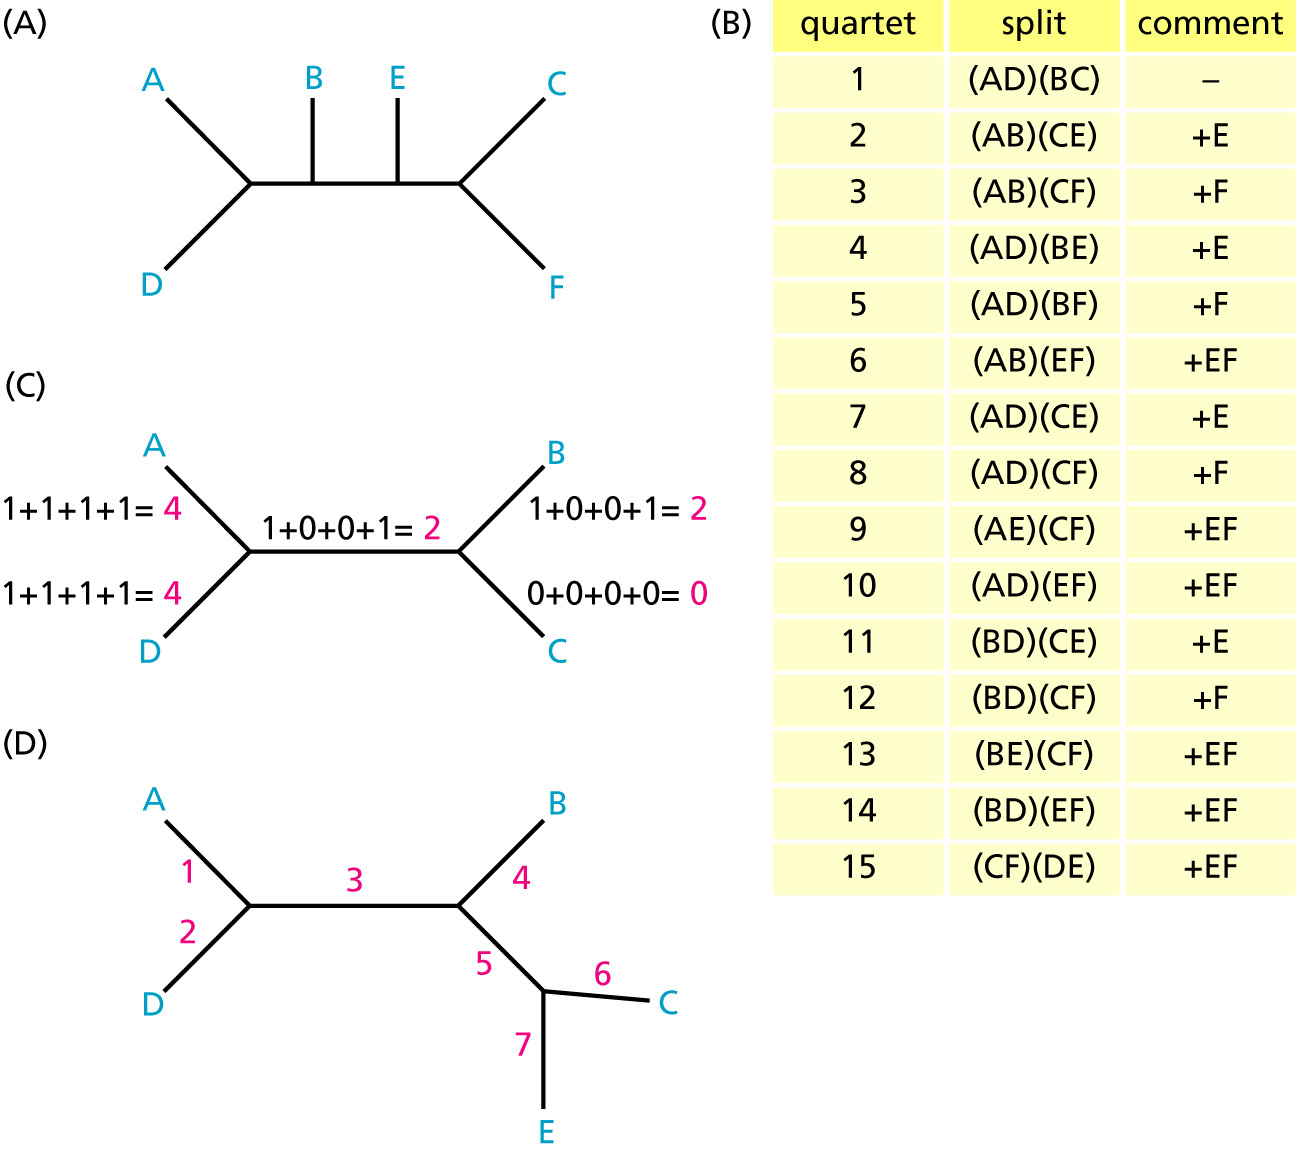
The resulting tree (called quartet puzzling tree) may not be ML tree. This algorithm is implemented in the TREE-PUZZLE program.
PhyML is a "simple hill-climbing algorithm that avoids the limits of the previous ones. The tree topology and branch lengths of a unique tree are simultaneously and progressively modified so that the tree likelihood increases at each step until an optimum is reached. During this process, we can also adjust the model parameters, such as the transition/transversion ratio or the gamma shape parameter accounting for rate variation among sites." (Guindon and Gascuel 2003).
The Likelihood ratio test (LRT)
If you want to compare two models of evolution (this includes the tree) given a certain data set, you can utilize the so-called maximum likelihood ratio test. If L0 and L1 are the likelihoods of the two models (hypotheses H0 and H1), &Delta = 2(logL1-logL0) approximately follows a Chi square distribution with n degrees of freedom. Usually n is the difference in model parameters (i.e., how many parameters are used to describe the substitution process) or the difference in branches between two trees (one tree is more resolved than the other). This test can only be applied if one model is a nested within the other.
Example (adapted from Table 4.2, Z. Yang, Computational Molecular Evolution, Oxford University Press, 2006):
| Model | log L | |
| JC69 (H0) | -6262.01 | |
| K80 (H1) | -6113.86 | κ=3.561 |
| HKY85 (H2) | -6101.76 | κ=3.620 |
| HKY85+Γ (H3) | -5764.26 | κ=4.296, α=0.175 |
Δ1=2(logL1-logL0)=2(-6113.86+6262.01)=296.3, n=1
Δ2=2(logL2-logL1)=2(-6101.76+6113.86)=22.2, n=3
Δ3=2(logL3-logL2)=2(-5764.26+6101.76)=675, n=1
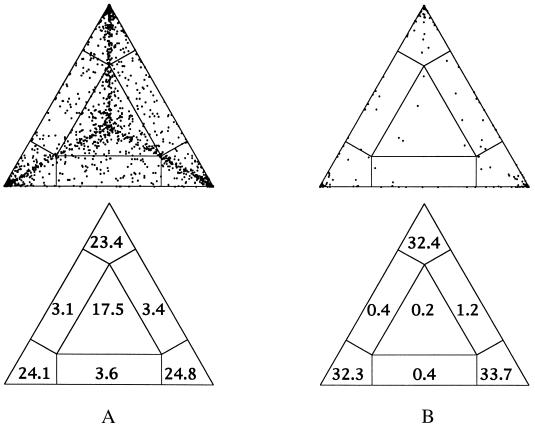
Maximum Likelihood Mapping
An often-encountered problem in inspecting trees is the assessment of support for different groupings on the tree. Maximum likelihood mapping (invented by Korbinian Strimmer) offers a graphical approach to this problem.
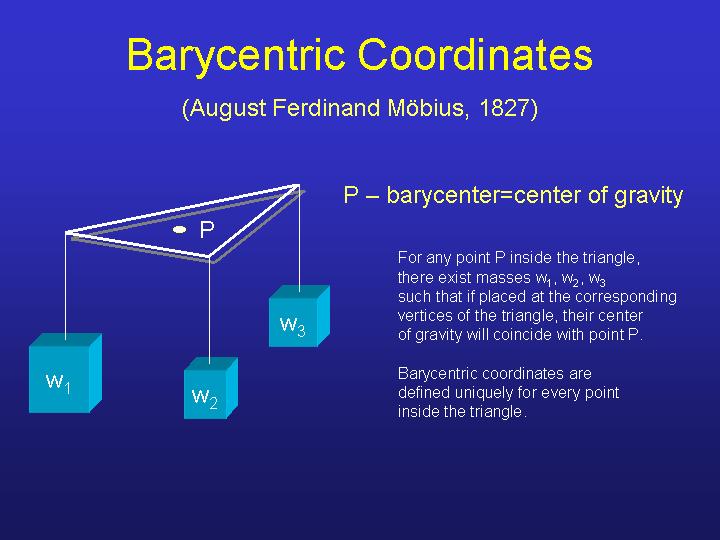
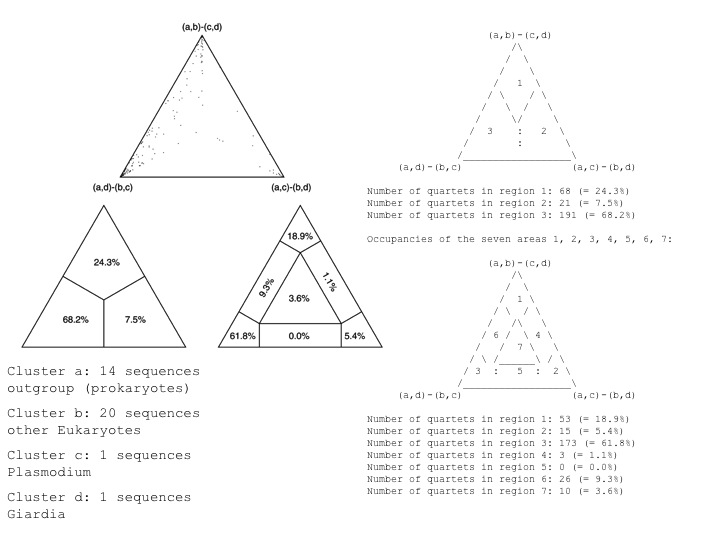
You can generate a ML-map for a single branch, or for the complete dataset. The principle is that for each possible quartet, the probabilities for the three tree topologies (with ML estimates for branch lengths) are plotted in barycentric coordinate system. (Pi= Li/(L1+L2+L3). If you generate a plot for the whole tree, you learn about how many quartets are resolved with confidence, if you plot only a single branch, you learn how many quartets support each of the possible orientations of the branch.

For example, if one wants to test if Giardia lamblia is the deepest branch within the eukaryotes, on can choose the "higher" eukaryotes as cluster a, another deep branching eukaryote (one that competes against Giardia) as cluster b, Giardia as cluster c, and the outgroup as cluster d. Here is an output of corresponding ML mapping analyses performed in TREE-PUZZLE:
Application of ML mapping to comparative genome analyses
Similarly ML mapping can be used to ascertain different phylogenetic signals present in gene content of four genomes, such as described here and here.


